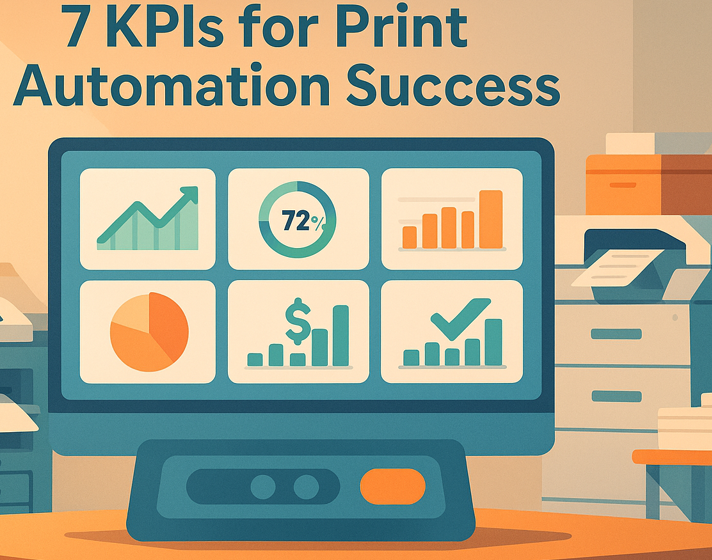
Automation in printing helps businesses meet growing demand by simplifying processes and ensuring efficiency. But how do you know if your print automation is working well? By tracking these 7 Key Performance Indicators (KPIs):
- Time to Complete Orders: Monitor how long it takes from order submission to delivery. Identify delays and improve workflows.
- Equipment Usage Rates: Measure how efficiently your machines are being used to minimize downtime.
- Print Output Quality: Ensure consistent color, sharpness, and durability to reduce waste and maintain customer satisfaction.
- Print Error Rates: Track errors like misalignments or color mismatches to identify recurring issues and cut costs.
- Delivery Performance: Evaluate how quickly and accurately orders are delivered to maintain customer trust.
- Staff Cost Ratio: Compare labor costs to production costs to assess the efficiency of your workforce.
- Customer Feedback Scores: Gather insights from customer satisfaction surveys, NPS, and delivery feedback to refine operations.
Why These KPIs Matter:
- Spot bottlenecks and improve production speed.
- Reduce errors and waste, saving time and resources.
- Enhance customer satisfaction by delivering quality products on time.
Quick Tip: Use automation tools to track these metrics in real time. This helps you make data-driven decisions, optimize operations, and maintain consistent quality.
Read on to explore how to analyze these KPIs and improve your print automation processes.
Own Real-Time KPIs: Avoid Operational Failure
What Makes Print Automation Work
Effective print automation depends on advanced tools and systems that streamline operations and handle large-scale demands. Let’s break down the key elements driving its success.
Integrated Technology Systems
Production management software plays a key role in keeping print operations efficient and organized. Integration across systems ensures everything works together seamlessly, reducing delays and errors.
Faster Production Through Technology
Modern technology speeds up production by handling orders quickly while maintaining high-quality results. For instance, Scalable Press uses systems designed to process orders rapidly while meeting market expectations for quality and efficiency.
1. Time to Complete Orders
Order completion time is a key metric that affects both the efficiency of your operations and customer satisfaction in print automation. It measures how long it takes for an order to go from submission to delivery, offering insight into production performance.
Turnaround Times for Different Print Methods
Each printing method has its own typical turnaround time, depending on complexity and production needs. Here’s a quick breakdown:
| Print Method | Standard Turnaround |
|---|---|
| Screen Printing | 3 – 7 days |
| DTG Printing | 3 – 5 days |
| Digital Printing | 72 hours |
| Sublimation | 72 hours |
| Embroidery | 3 – 5 days |
Why It Matters for Your Business
Tracking how long it takes to complete orders helps you spot areas where processes slow down and improve workflows. For example, companies like Scalable Press use automated systems to ensure consistent turnaround times, even with high order volumes.
What Affects Completion Times?
Several factors influence how quickly orders are completed, including:
- How fast orders are processed
- Time spent on the actual printing
- Quality control and inspection time
- Shipping preparation and packaging
How Technology Improves Time Management
Modern print automation tools make it easier to track orders in real time. Digital systems can monitor every step, ensuring workflows stay on track and deadlines are met. This is especially critical for processes like digital and sublimation printing, where meeting 72-hour turnarounds requires precise planning and resource management.
Tracking and Improving Performance
To measure and improve order completion times, focus on:
- Tracking times by print method
- Comparing actual completion dates to projections
- Monitoring delays during busy seasons
- Analyzing bottlenecks and their causes
- Reviewing how process changes affect turnaround times
2. Equipment Usage Rates
Equipment usage rates measure how much time your machines spend actively working compared to the total time they’re available. This helps ensure your equipment operates at its full potential, keeping production efficient and consistent.
What Equipment Utilization Means
This metric focuses on the percentage of time your printing equipment is actively running versus sitting idle. It’s a straightforward way to gauge how effectively your machines are being used.
Using Technology to Monitor Performance
Modern tools and automation make it easier than ever to track and improve equipment usage. Advanced print automation systems can:
- Deliver real-time performance insights, helping you quickly spot underused machines.
- Support better planning and maintenance, reducing downtime and keeping operations on track.
3. Print Output Quality
Print output quality focuses on maintaining consistency and precision in automated printing. Meeting these standards helps reduce waste and improve customer satisfaction. It builds on earlier metrics by ensuring the quality of the final product aligns with production efficiency.
Key Factors in Measuring Quality
When evaluating print quality, pay attention to these areas:
- Color accuracy: Ensuring colors match the specified standards consistently.
- Image resolution: Producing prints with sharp, clear details.
- Print durability: Confirming prints hold up over time, even with repeated use or washing.
- Registration precision: Making sure all design elements are properly aligned.
Quality Standards by Printing Technique
Each printing method comes with its own quality benchmarks. Here’s a quick breakdown:
| Print Method | Key Quality Indicators | Quality Control Focus |
|---|---|---|
| DTG Printing | Color vibrancy, detail clarity | Achieving sharp, vibrant designs on fabric |
| Digital Printing | Resolution, color matching | Delivering consistent, high-quality results |
| Sublimation | Color saturation, full coverage | Ensuring even, seamless transfers |
| Screen Printing | Ink density, alignment | Maintaining precise layer positioning |
| Embroidery | Stitch uniformity, tension | Producing clean, well-defined patterns |
Automated Systems for Quality Assurance
Advanced systems now rely on tools like real-time inspection, color management software, and digital proofing. These technologies help detect and fix quality issues quickly.
Tracking Quality Metrics
Monitor key metrics like color consistency, image sharpness, defect rates, and customer feedback. This data helps identify and resolve problems before they impact production.
At Scalable Press, these practices are central to maintaining high standards in automated printing, ensuring every product meets customer expectations.
4. Print Error Rates
Tracking error rates is a key part of understanding print production performance. These rates highlight inefficiencies in the process, showing where improvements can be made to reduce waste and improve quality. By monitoring errors that lead to reprints, businesses can identify patterns and take steps to streamline operations.
Understanding Error Categories
Print errors come in different forms, and categorizing them helps identify where issues are occurring. Here are some common error types:
| Error Type | Impact | Key Metrics to Track |
|---|---|---|
| Registration Issues | Misaligned prints requiring reprints | Percentage of prints with alignment errors |
| Color Discrepancies | Incorrect color matching or saturation | Number of color-related rejections |
| Equipment Malfunctions | Production delays and wasted materials | Frequency of machine-related errors |
| Material Defects | Wasted resources and delayed orders | Rate of material-based rejections |
| File Processing Errors | Delays and setup issues before production | Percentage of file preparation mistakes |
Calculating Error Rates
To effectively track and manage errors, consider these steps:
- Daily Error Tracking: Log all errors as a percentage of total production volume.
- Error Classification: Categorize errors to uncover recurring problems.
- Cost Impact Analysis: Assess how much reprints and wasted materials are costing your business.
- Root Cause Documentation: Record the source of each error to focus on fixing specific issues.
These practices help create a clearer picture of where improvements are needed.
Automated Error Detection
Modern automation tools can catch errors before they escalate, saving time and materials. Examples include:
- Real-time print inspection: Flags issues during production to prevent costly mistakes.
- Automated color management: Ensures consistent color output across all prints.
- Digital workflow validation: Identifies file preparation problems before production starts.
These tools work together with established benchmarks to enhance production processes.
Setting Benchmarks
Companies like Scalable Press set strict thresholds to maintain quality and efficiency:
- Error rate: Less than 1% of total production.
- Color accuracy: Delta E ≤ 2.0 for consistent color matching.
- Registration accuracy: ±0.1mm tolerance for alignment.
- Equipment uptime: A minimum reliability of 98%.
5. Delivery Performance
Delivery performance plays a key role in assessing the success of print automation and keeping customers happy. Tracking how quickly orders are processed and delivered helps spot delays and improve shipping processes, which is essential for maintaining customer confidence.
At Scalable Press, delivery tracking is a core part of the automated fulfillment system. Regular reviews help identify problem areas and implement timely solutions, ensuring orders are delivered as promised while continuously refining operations.https://app.seobotai.com/banner/inline/?id=sbb-itb-bd3491f
6. Staff Cost Ratio
The staff cost ratio evaluates how efficiently your workforce operates by comparing labor expenses to production costs. It’s calculated as: (labor expenses / production costs) × 100. A lower ratio suggests better use of automation.
At Scalable Press, automation plays a key role in controlling labor costs while maintaining quality. By automating repetitive tasks, staff can focus on more valuable work.
Here are the main factors to monitor when assessing the staff cost ratio:
- Direct labor costs: Salaries and benefits for production staff.
- Indirect labor expenses: Wages for management and support roles.
- Training costs: Expenses for upskilling employees to work with automated systems.
- Overtime hours: Additional costs incurred during busy periods.
- Productivity metrics: Output achieved per labor hour.
These elements help identify areas for improvement. Ideally, an automated print operation should aim for a staff cost ratio between 25-35% of total production costs. Ratios exceeding 40% may indicate the need for more automation or better staff allocation.
To improve your staff cost ratio, consider these strategies:
- Optimize scheduling: Adjust staffing levels for peak and off-peak times.
- Cross-train employees: Equip your team to handle multiple roles across processes.
- Identify automation opportunities: Look for tasks that could be automated.
- Track overtime trends: Address recurring patterns that inflate labor costs.
Improving this ratio isn’t about cutting jobs – it’s about empowering your team to deliver greater value through smart automation and effective workforce planning.
7. Customer Feedback Scores
Customer feedback plays a crucial role in evaluating how well your automated print process aligns with customer expectations. It adds an external perspective to your internal metrics, offering a complete view of performance and opportunities for improvement.
Here are some key feedback metrics to monitor:
- Net Promoter Score (NPS): Tracks customer loyalty on a scale from -100 to +100.
- Customer Satisfaction Score (CSAT): Measures satisfaction with specific interactions on a 1-5 scale.
- Customer-Assessed Product Quality: Reflects user opinions on the quality of print results.
- Delivery Satisfaction: Focuses on feedback related to shipping and delivery experiences.
To gather actionable insights, request feedback at critical points: after order confirmation, post-production, upon delivery, and following any customer service interaction. Include questions about order processing speed, print quality, communication, and how well issues are handled.
Keep an eye on trends over time:
- Weekly satisfaction averages
- Monthly quality assessments
- Quarterly NPS results
- Year-over-year comparisons
When combined with operational metrics, this feedback helps refine and improve your automated print processes.
Using Data to Improve Print Operations
Real-time KPI monitoring turns raw data into actionable insights, allowing immediate adjustments to workflows and resource allocation. For example, it can highlight production bottlenecks – like one printer being overloaded while others sit idle – making it easier to redistribute workloads and plan capacity more effectively.
By continuously tracking print output quality and error rates, real-time data can catch problems early. This means issues can be resolved before they disrupt larger batch runs, saving both time and resources.
Here’s how various metrics can work together to improve operations:
| Metric Category | Real-Time Benefit | Improvement Action |
|---|---|---|
| Time to Complete | Detects delays in processing | Adjust automation rules or redistribute tasks |
| Equipment Usage | Monitors capacity utilization | Balance machine workloads and plan maintenance |
| Quality Metrics | Identifies recurring errors | Update printer settings or refine quality controls |
| Delivery Data | Exposes logistical inefficiencies | Fine-tune shipping routes and packaging methods |
These insights allow for immediate corrective actions across production, enhancing efficiency and reducing downtime. This approach builds on earlier KPI tracking methods, offering a more dynamic way to manage operations.
Real-time data doesn’t just optimize how resources are deployed – it also helps with long-term planning. For instance, it can guide decisions about staffing, automation, or whether to invest in new equipment. Key areas of focus include:
- Spotting opportunities for automation
- Scheduling staff for peak efficiency
- Deciding between hiring more staff or upgrading equipment
This cycle of improvement typically follows these steps:
- Monitor KPIs
- Identify trends and deviations
- Adjust processes
- Measure results
- Refine strategies based on findings
Connecting Metrics with Print Services
Modern print automation depends on advanced systems to monitor performance metrics and improve operations. At Scalable Press, we use integrated monitoring and automation tools to gather and analyze key production data from our global fulfillment centers. This setup allows us to respond quickly to production challenges as they arise.
Real-Time Monitoring
Our software continuously tracks key performance indicators (KPIs) across various printing methods. This constant monitoring gives us the visibility needed to make quick adjustments, ensuring consistent quality throughout the production process.
Tech-Driven Quality Control
Our technology team has developed automated solutions that embed quality monitoring into our production systems. This approach has enabled us to produce over 10 million printed items while maintaining high standards of quality.
Streamlined Workflow Automation
Using real-time data, we’ve optimized workflows through a single-invoice ordering system that handles:
- Order intake and validation
- Management of production queues
- Allocation of resources
- Quality checks
- Fulfillment tracking
This streamlined process reduces manual steps, making operations more efficient and scalable.
Using Data for Better Operations
With our integrated monitoring systems, we can:
- Quickly pinpoint bottlenecks in production
- Improve how resources are used across facilities
- Provide more accurate delivery estimates
Tips for Tracking Print Metrics
Refining your approach to tracking print automation metrics can lead to more accurate performance data and better decision-making. Here’s how to get started:
Set Clear Baseline Measurements
Track your current key performance indicators (KPIs) over a 30-day period. This establishes a solid starting point for comparison.
Standardize Data Collection Methods
Consistency is key when gathering metrics across various printing processes. To ensure uniformity:
- Use the same measurement intervals for all data points.
- Identify specific points in the workflow where metrics will be collected.
- Clearly document how each KPI is calculated.
- Train your team on proper data entry practices.
These steps help ensure you’re working with reliable and actionable data.
Implement Real-Time Monitoring
Integrate your production equipment with monitoring software. This setup automates data collection, reduces errors, and provides instant insights into your operations.
Create Performance Dashboards
Visual dashboards can make it easier to track and interpret your metrics. Include key elements like:
- Daily production totals.
- Comparisons of current metrics versus targets.
- Trend analysis to identify patterns over time.
- Alerts for metrics that fall outside acceptable ranges.
Dashboards make it simple to spot issues and take corrective action quickly.
Regular Data Validation
To maintain accuracy, check your data weekly. Key steps include:
- Comparing automated data with manual records.
- Verifying calculations for consistency.
- Looking for unusual patterns or anomalies.
- Recording and addressing any discrepancies.
Establish Review Cycles
Hold monthly meetings with teams from different departments to review trends, discuss findings, and adjust your tracking methods as needed.
Document Contextual Factors
Keep detailed records of external influences that may affect your metrics, such as:
- Equipment maintenance schedules.
- Staff training sessions.
- Seasonal changes in production demand.
- Changes in material suppliers.
This additional context can help explain fluctuations in your data and provide a clearer picture of overall performance.
Conclusion
Regularly tracking and improving print automation metrics is key to achieving long-term success. Keeping a close eye on these numbers helps businesses make smarter decisions and improve how they operate.
Automation speeds up mass customization, but its success hinges on consistently analyzing and fine-tuning processes using data. Focusing on these metrics ensures steady growth and helps businesses adapt quickly to shifts in the market.
FAQs
×
How do real-time monitoring tools improve the efficiency of print automation?
Real-time monitoring tools play a crucial role in enhancing the efficiency of automated print production processes. By providing immediate insights into production metrics, these tools allow businesses to identify and address issues as they arise, reducing downtime and ensuring smoother workflows.
With features like live tracking of job statuses, equipment performance, and resource utilization, real-time monitoring helps streamline operations and optimize productivity. These tools also enable data-driven decisions, allowing print businesses to continually refine their processes for better efficiency and cost savings.×
How can print businesses optimize staff costs while using automation?
To optimize staff costs in print automation, businesses can focus on streamlining workflows and leveraging technology to reduce manual intervention. Key strategies include:
- Investing in training: Equip your team with the skills needed to operate and manage automated systems efficiently, reducing errors and downtime.
- Analyzing production data: Use automation software to monitor staff performance and identify areas where processes can be further optimized.
- Scaling operations smartly: Adjust staffing levels based on production demand, ensuring resources are allocated effectively without overstaffing.
By implementing these strategies, businesses can achieve a better balance between labor costs and productivity, leading to improved profitability.×
Why should customer feedback scores be combined with operational metrics in print automation?
Integrating customer feedback scores with operational metrics is essential for gaining a complete understanding of your print automation performance. While operational metrics track efficiency and productivity, customer feedback provides insight into the end-user experience, helping you identify areas for improvement.
By combining the two, print businesses can align their processes with customer expectations, ensuring not only faster and more cost-effective production but also higher satisfaction and loyalty. This holistic approach allows you to make data-driven decisions that enhance both operational success and customer outcomes.
Leave a Reply